TL;DR
I consulted for AptDeco.com while I was a Fellow with Insight Data Science NYC (S17). My goal was to build a machine learning model to predict which furniture items are likely to sell. The best results came from a Random Forest classifier tuned with GridSearch and cross-validation achieving accuracy of 92%. This work will have a real-world impact on how AptDeco ranks their products to users, boosting item sell-through and helping maximize revenue.
Consulting for AptDeco
Started out of Y-Combinator, the Insight program is seven weeks of intense immersion into data science, the kind that is poised to meaningfully impact nearly every industry that exists. More than that, it’s an opportunity to focus on a self-driven project, get your hands dirty with the little details, and get a crash course in the everyday tools that drive the booming data science industry.
From the beginning, Insight laid out our specific goals, taking a page straight from the Agile philosophy – create an MVP (or, Minimum Viable Product), collect feedback, and improve. By using this process, you improve your core product on each iteration. This philosophy is also supremely relevant to a business setting. Often you can get eighty percent of the way there with only twenty percent of the resources. Many Insight Fellows, including me, come from scientific and academic backgrounds where the goal is to be as thorough as possible, no matter the time it takes. In business, this is just not possible. Companies need to move fast. So the goal should be to aim for the biggest impact you can make in the least time and with as few resources as possible. This was the framework within which I set out on my summer project.
While at Insight, I had the opportunity to consult for AptDeco.com (Also started out of Y-Combinator. I know, small world). AptDeco is a peer-to-peer marketplace where users can buy and sell furniture. The AptDeco team handles all of the logistics, making furniture buying and selling much easier on the customer than other marketplaces.
A quick glance at the AptDeco homepage will give you a feel for how the site is structured; items are divided into categories, and then further into smaller categories. So say for example you’re feeling rather lounge-y and decide to browse ‘Sofas.’ At the time of writing, there are 1,494 sofas displayed. This leads us up to the problem and the task at hand:
As your company grows and the number of products increases, how do you present relevant items to new users?
A fair first shot is to simply show the items chronologically, that is, the most recently posted items on the first page and so forth. If the velocity of new postings is rapid, perfectly good items can get buried under the heap, while the ‘newer’ items will be the first things visiting customers see. Remember, ‘newer’ does not mean ‘better’ or ‘more likely to sell.’
In consulting with AptDeco, we decided on a strategy to develop a machine learning model to predict, with some level of certainty, which items will sell. To make this more concrete, let me explain some of the data we have. We know some of the item features: price, age, condition, as well as details about how users interact with the items, such as item views and adding items to a checkout cart. We also know whether items were purchased or not so we can use this info as labels for our binary classifier. Great so how do we get started?
A cursory glance over the data revealed various different product types: sofas, storage units, dressers, lamps. And the list goes on. I was intrigued by whether products would cross-predict, that is, would knowing how dressers sell allow you to make predictions on lamps? Given the limited time and the desire to make the greatest impact possible, I decided to narrow the focus to sofas. These are one of the higher-volume sellers, so this would be a great place to start.
After flexing my Pandas skills to apply the requisite data cleaning, accounting for NULL values and munging it all together, I finally had a Pandas DataFrame that contained my features for every sofa item.
| Features |
|---|
| price |
| age |
| condition |
| views |
| wishlist adds |
| cart adds |
My labels were simply boolean values: True = Purchased, False = Not Purchased
Next came model selection. Initially I experimented with a handful of classifiers without much tuning. The models themselves were the Scikit-Learn implementations: Stochastic Gradient Descent, Logistic Regression and Random Forest. Random Forest provided the best accuracy out of the box at 88%. Leveraging the elegant tool sets provided by SKLearn, I let GridSearchCV do the heavy lifting in determining the best model hyperparameters.
After grid search, my random forest with 250 trees and some other tuned hyperparameters achieved 92% accuracy.
For those unfamiliar, Random Forest is an ensemble machine learning algorithm. The idea is that you combine a bunch of weak learners, in this case decision trees (think ‘twenty questions’), train them on subsets of the data, and let them vote on what the classification should be. In the end, when the trees are polled, there will be a majority decision about which class the data represent. The basic premise is that, much like in the real world, the group decision is better than the individual.
Further breaking down the results
Often when evaluating the performance of a classifier we care about more than accuracy. Especially when classes are not balanced. For example, if you’re predicting the percentage of fire trucks that are red and just guess ‘Yes’ (red) every time, you can get 90% accuracy given that 90% of fire trucks are red. But you haven’t really learned anything.
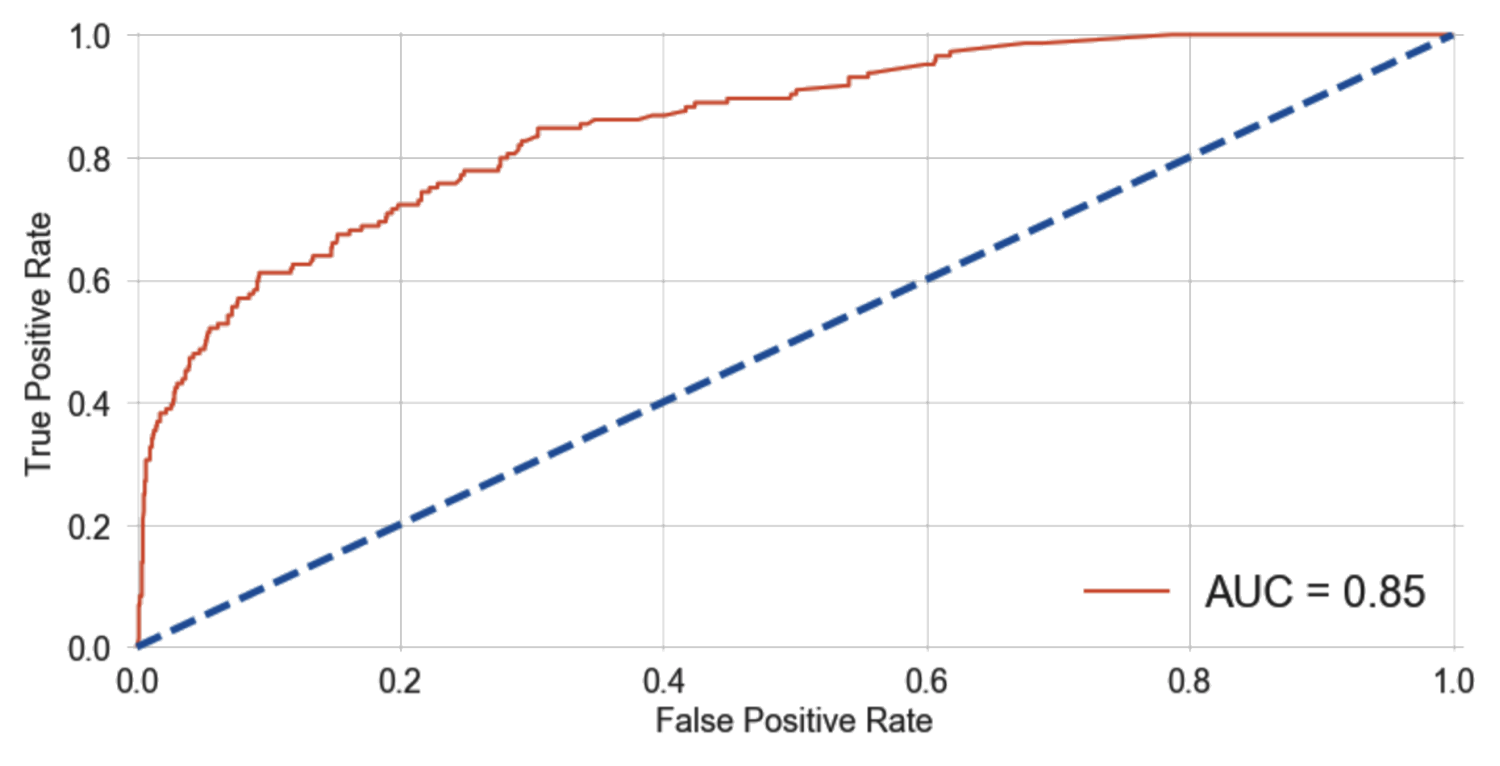
Below is the model’s Receiver Operating Characteristic (ROC) curve for which we plot the True Positive Rate (y-axis) over the False Positive Rate (x-axis). If your classifier is performing at chance (basically guessing) you’d have about the same percentage of False Positives as True Positives (dashed blue line). Ideally, your plot will increase faster along the y-axis than the x-axis as displayed in the ROC curve below (orange).
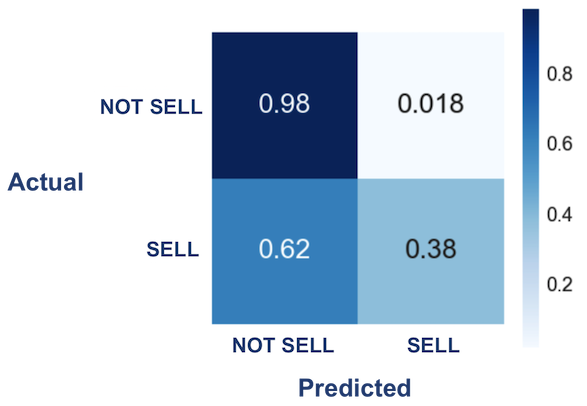
Another thing that helps us visualize classifier performance is a confusion matrix, as seen in the heatmap below. This allows us to clearly see how often the classifier makes errors. Here we are showing ratios. So given items that didn’t sell, our classifier got about 98% of these right and only made an error on less than 2%. This illustrates that for our case, the classifier is much better at determining items that will not sell. And what’s great for us is that it rarely gives false positives. This is important because one thing we definitely do not want to do is push ‘less good’ items to the top of the list in spite of better items. But alas, this is a double-edged sword as the classifier has a slight tendency to miss items that will sell, classifying them as non-sellers. Ultimately, it correctly predicts roughly 40% of items that will sell, giving us a subset of correct predictions to work with.
To sum up, our goal was to identify items that will sell from a catalog of furniture. We collected and formatted data, experimented with a few machine learning algorithms, and selected and tuned the best one. In the end, the classifier is able to identify a subset of items that are likely to sell. Given a new item, we can allow the classifier to make a prediction from the item’s features and get an answer. By taking the subset of items predicted to sell and then further applying an additional ranking algorithm on top, we can get closer to showing the best items first. Of course, proper A/B testing before putting this model into full production will be key.
Many more directions
Recalling our original focus on MVP, we got fairly decent results and we got them quickly. And that’s great. But that said, there are many more directions we can go. First, we will need to adapt our algorithm as time passes. In addition, there are many other features we can play with. For example, the items have user-written descriptions that may hold predictive value. We can try to apply natural language processing to identify items with descriptions similar to those that sell. The items also have images. We can use computer vision algorithms to extract features from product images. Additionally, we can use customer browsing patterns to present each user with results tailored specifically to them using collaborative filtering. These are all really interesting avenues to explore and will likely allow us to squeeze even more performance out of our algorithm. Ultimately, using this trained model should get us closer to the real goal of increasing product sell-through and boosting revenue. Time will tell.
I want to extend a special thanks to Ramón Cacho and the team at AptDeco.com for the opportunity to work with their data and help make an impact on their business operations.
A bit about me
My name is Jason Dwyer and I performed this work while I was a Fellow with Insight Data Science in NYC (S17). I received my PhD in Neuroscience from Yale in 2015, and have over a decade of experience in the pharmaceutical research industry. I am a self-taught programmer for iOS and Android and a general enthusiast of all things software and machine learning.
Get in touch on Twitter @jm_dwyer